AI Bootcamp 스무번째
Updated:

스무번째 Diary
Ridge Regression
ridge regression 은 다항회귀분석의 다중공선성과 over-fitting(과적합) 문제를 방지하기 위해 정규화 방식이 적용되었다.
여기서 다중공정성이란 독립변수 x들간의 강한 상관관계가 나타나서, 독립변수들이 독립적이지 않는 문제가 발생하게 되는 현상을 말한다. 이 경우 coefficient 추정치가 부정확해지고 standard error 값이 높아지게 된다.
릿지 회귀는 선형회귀모델의 비용함수(Cost Function)에 패널티를 적용한 것이다. 여기서 패널티는 Lambda * 계수 coefficient 제곱의 합이다. 이때 Lambda 값이 0 에 가까워지면 Ridge 는 본래 선형회귀모델의 Cost Function 에 가까워지게 된다.
반면에 Lambda 의 값이 어느정도 크다면, coefficient 의 크기가 줄어서 모델의 복잡도가 줄어들고 다중공성선 문제의 영향을 줄어들게 할 수 있게 된다. 왜냐면 서로 영향을 미치는 독립변수들의 weight가 줄어드는 것이기 때문이다.
$ \sum_{i=1}^M (y_i-\hat{y_i})^2 = \sum_{i=1}^M (y_i- \sum_{j=0}^P w_j \times x_{ij})^2 + \lambda \sum_{j=0}^P w_j^2 $
- Ridge’s Cost Function
# library import

import pandas as pd
import numpy as np
from sklearn.preprocessing import LabelEncoder
from collections import Counter
from sklearn.feature_selection import f_regression, SelectKBest
from sklearn.preprocessing import StandardScaler
from sklearn.decomposition import PCA
from sklearn.linear_model import LinearRegression, Ridge
from sklearn.model_selection import cross_val_score
from sklearn.metrics import confusion_matrix
from sklearn.model_selection import train_test_split
from sklearn.metrics import mean_squared_error
import seaborn as sns
import matplotlib.pyplot as plt

# 레티나 설정 : 글자가 흐릿하게 보이는 현상 방지
%config InlineBackend.figure_format = 'retina'

# warning 방지
import warnings
warnings.filterwarnings(action = 'ignore')
wine = pd.read_csv('https://raw.githubusercontent.com/Liam427/stuydy-data/main/data/winequality-red.csv')
wine.head()
| fixed acidity | volatile acidity | citric acid | residual sugar | chlorides | free sulfur dioxide | total sulfur dioxide | density | pH | sulphates | alcohol | quality | |
|---|---|---|---|---|---|---|---|---|---|---|---|---|
| 0 | 7.4 | 0.70 | 0.00 | 1.9 | 0.076 | 11.0 | 34.0 | 0.9978 | 3.51 | 0.56 | 9.4 | 5 |
| 1 | 7.8 | 0.88 | 0.00 | 2.6 | 0.098 | 25.0 | 67.0 | 0.9968 | 3.20 | 0.68 | 9.8 | 5 |
| 2 | 7.8 | 0.76 | 0.04 | 2.3 | 0.092 | 15.0 | 54.0 | 0.9970 | 3.26 | 0.65 | 9.8 | 5 |
| 3 | 11.2 | 0.28 | 0.56 | 1.9 | 0.075 | 17.0 | 60.0 | 0.9980 | 3.16 | 0.58 | 9.8 | 6 |
| 4 | 7.4 | 0.70 | 0.00 | 1.9 | 0.076 | 11.0 | 34.0 | 0.9978 | 3.51 | 0.56 | 9.4 | 5 |
wine.isnull().sum()
fixed acidity           0
volatile acidity        0
citric acid             0
residual sugar          0
chlorides               0
free sulfur dioxide     0
total sulfur dioxide    0
density                 0
pH                      0
sulphates               0
alcohol                 0
quality                 0
dtype: int64
bins = (2, 6.5, 8)
labels = ['bad', 'good']
wine['quality'] = pd.cut(x = wine['quality'], bins = bins, labels = labels)
print(wine['quality'].value_counts(normalize=True))
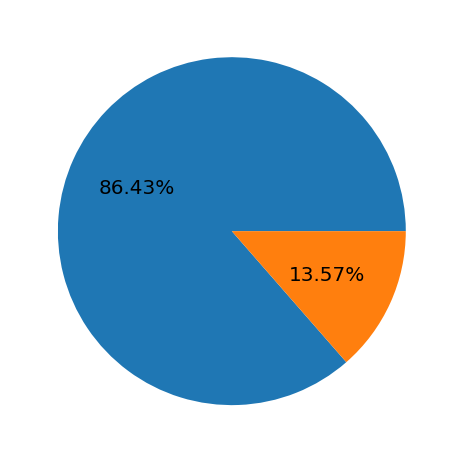
plt.pie(wine['quality'].value_counts(normalize=True), autopct='%1.2f%%')
plt.show();
bad     0.86429
good    0.13571
Name: quality, dtype: float64

- 잘 분류가 되었지만, target feature 가 비율이 굉장히 차이가 많이 난다고 생각한다.
labelencoder_wine = LabelEncoder()
wine['quality'] = labelencoder_wine.fit_transform(wine['quality'])
wine.head()
| fixed acidity | volatile acidity | citric acid | residual sugar | chlorides | free sulfur dioxide | total sulfur dioxide | density | pH | sulphates | alcohol | quality | |
|---|---|---|---|---|---|---|---|---|---|---|---|---|
| 0 | 7.4 | 0.70 | 0.00 | 1.9 | 0.076 | 11.0 | 34.0 | 0.9978 | 3.51 | 0.56 | 9.4 | 0 |
| 1 | 7.8 | 0.88 | 0.00 | 2.6 | 0.098 | 25.0 | 67.0 | 0.9968 | 3.20 | 0.68 | 9.8 | 0 |
| 2 | 7.8 | 0.76 | 0.04 | 2.3 | 0.092 | 15.0 | 54.0 | 0.9970 | 3.26 | 0.65 | 9.8 | 0 |
| 3 | 11.2 | 0.28 | 0.56 | 1.9 | 0.075 | 17.0 | 60.0 | 0.9980 | 3.16 | 0.58 | 9.8 | 0 |
| 4 | 7.4 | 0.70 | 0.00 | 1.9 | 0.076 | 11.0 | 34.0 | 0.9978 | 3.51 | 0.56 | 9.4 | 0 |
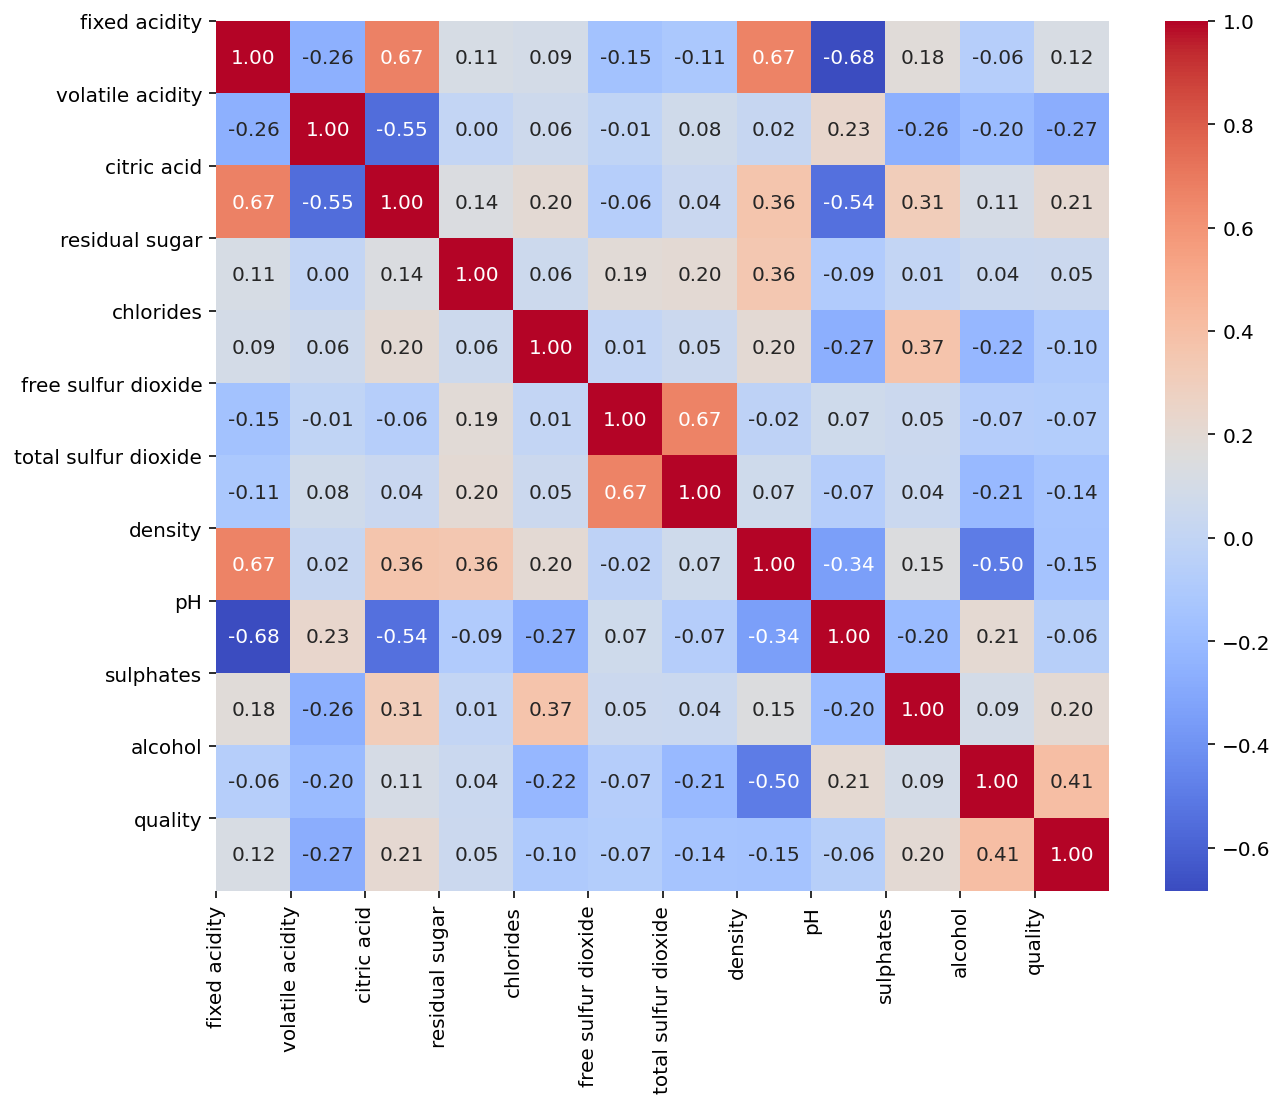
wine_corr = wine.corr()

fig, ax = plt.subplots(figsize=(10, 8))

sns.heatmap(wine_corr, cmap='coolwarm', annot=True, fmt=".2f")
plt.xticks(range(len(wine_corr.columns)), wine_corr.columns)
plt.yticks(range(len(wine_corr.columns)), wine_corr.columns)

plt.show();

f, axes = plt.subplots(1,2,figsize=(14,4))

sns.distplot(wine['fixed acidity'], ax = axes[0])
axes[0].set_xlabel('Fixed Acidity', fontsize=14)
axes[0].set_ylabel('Count', fontsize=14)
axes[0].yaxis.tick_left()
plt.grid(True)

sns.violinplot(x = 'quality', y = 'fixed acidity', data = wine, hue = 'quality',ax = axes[1])
axes[1].set_xlabel('Quality', fontsize=14)
axes[1].set_ylabel('Fixed Acidity', fontsize=14)
axes[1].yaxis.set_label_position("right")
axes[1].yaxis.tick_right()

plt.show();

f, axes = plt.subplots(1,2,figsize=(14,4))

sns.distplot(wine['volatile acidity'], ax = axes[0])
axes[0].set_xlabel('Volatile Acidity', fontsize=14)
axes[0].set_ylabel('Count', fontsize=14)
axes[0].yaxis.tick_left()

sns.violinplot(x = 'quality', y = 'volatile acidity', data = wine, hue = 'quality',ax = axes[1])
axes[1].set_xlabel('Quality', fontsize=14)
axes[1].set_ylabel('Volatile Acidity', fontsize=14)
axes[1].yaxis.set_label_position("right")
axes[1].yaxis.tick_right()

plt.show();

f, axes = plt.subplots(1,2,figsize=(14,4))

sns.distplot(wine['citric acid'], ax = axes[0])
axes[0].set_xlabel('Citric Acid', fontsize=14)
axes[0].set_ylabel('Count', fontsize=14)
axes[0].yaxis.tick_left()

sns.boxenplot(x = 'quality', y = 'citric acid', data = wine, hue = 'quality',ax = axes[1])
axes[1].set_xlabel('Quality', fontsize=14)
axes[1].set_ylabel('Citric Acid', fontsize=14)
axes[1].yaxis.set_label_position("right")
axes[1].yaxis.tick_right()

plt.show();

f, axes = plt.subplots(1,2,figsize=(14,4))

sns.distplot(wine['residual sugar'], ax = axes[0])
axes[0].set_xlabel('Residual Sugar', fontsize=14)
axes[0].set_ylabel('Count', fontsize=14)
axes[0].yaxis.tick_left()

sns.violinplot(x = 'quality', y = 'residual sugar', data = wine, hue = 'quality',ax = axes[1])
axes[1].set_xlabel('Quality', fontsize=14)
axes[1].set_ylabel('Residual Sugar', fontsize=14)
axes[1].yaxis.set_label_position("right")
axes[1].yaxis.tick_right()

plt.show();

f, axes = plt.subplots(1,2,figsize=(14,4))

sns.distplot(wine['chlorides'], ax = axes[0])
axes[0].set_xlabel('Chlorides', fontsize=14)
axes[0].set_ylabel('Count', fontsize=14)
axes[0].yaxis.tick_left()

sns.violinplot(x = 'quality', y = 'chlorides', data = wine, hue = 'quality',ax = axes[1])
axes[1].set_xlabel('Quality', fontsize=14)
axes[1].set_ylabel('Chlorides', fontsize=14)
axes[1].yaxis.set_label_position("right")
axes[1].yaxis.tick_right()

plt.show();

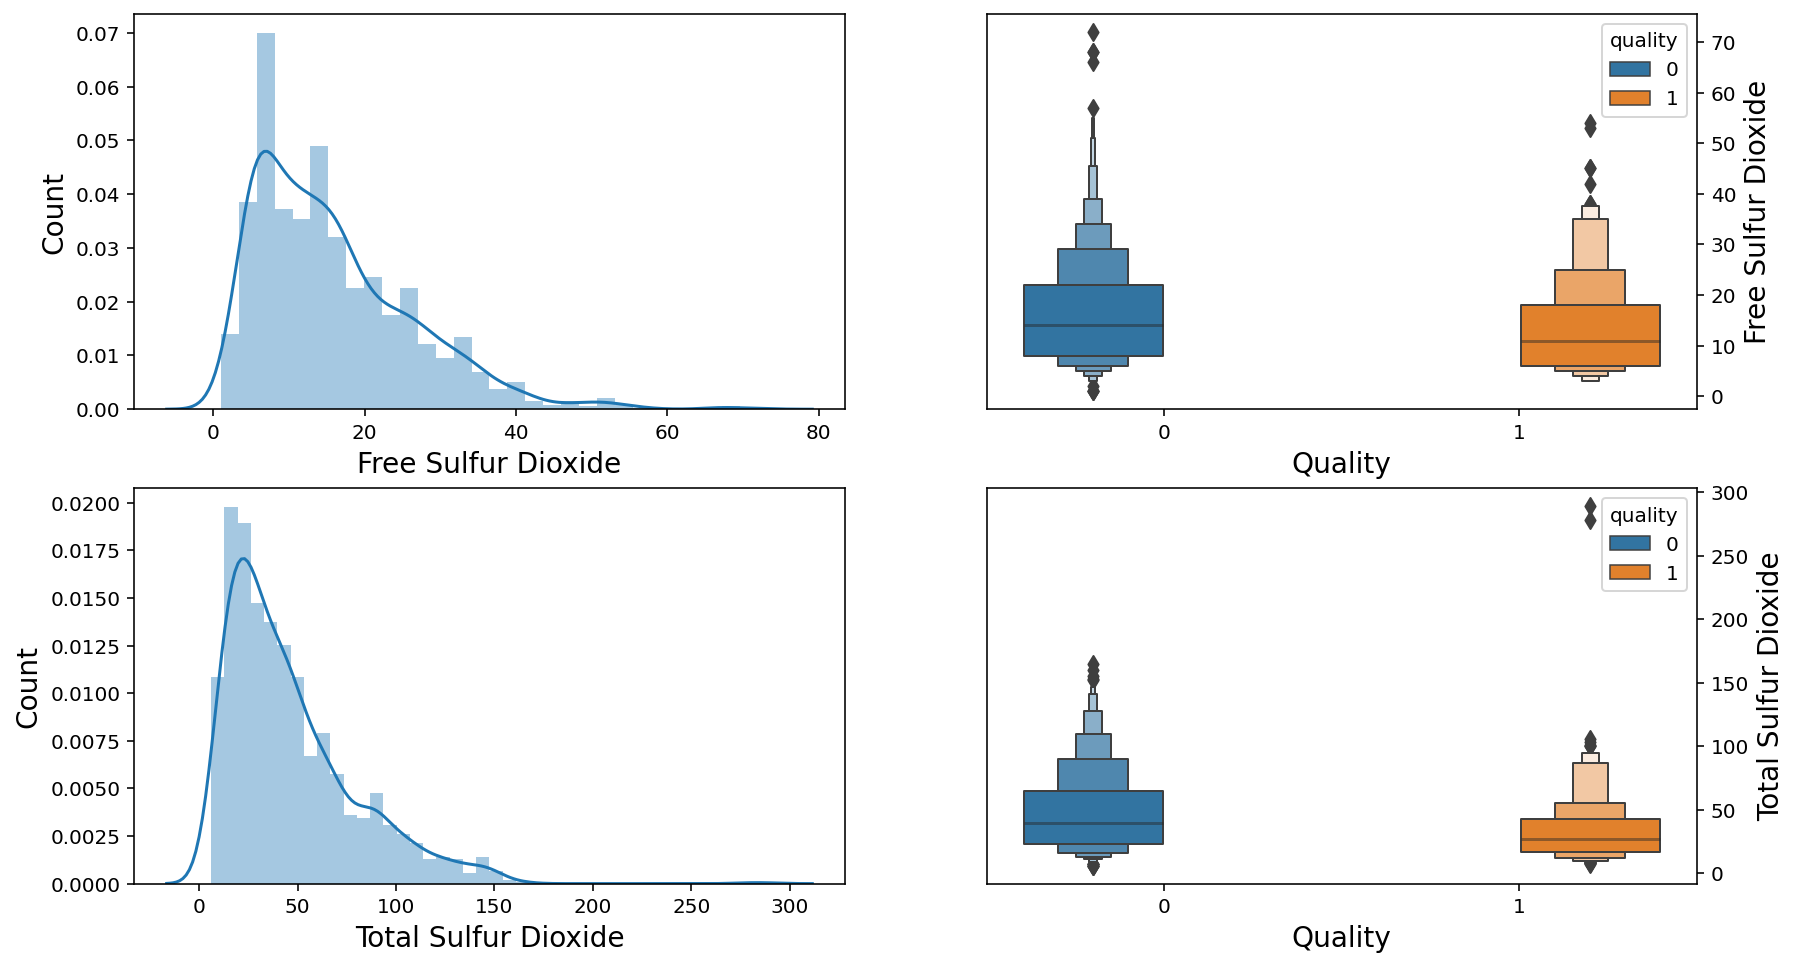
f, axes = plt.subplots(2,2,figsize=(14,8))

sns.distplot(wine['free sulfur dioxide'], ax = axes[0,0])
axes[0,0].set_xlabel('Free Sulfur Dioxide', fontsize=14)
axes[0,0].set_ylabel('Count', fontsize=14)
axes[0,0].yaxis.tick_left()

sns.boxenplot(x = 'quality', y = 'free sulfur dioxide', data = wine, hue = 'quality',ax = axes[0,1])
axes[0,1].set_xlabel('Quality', fontsize=14)
axes[0,1].set_ylabel('Free Sulfur Dioxide', fontsize=14)
axes[0,1].yaxis.set_label_position("right")
axes[0,1].yaxis.tick_right()

sns.distplot(wine['total sulfur dioxide'], ax = axes[1,0])
axes[1,0].set_xlabel('Total Sulfur Dioxide', fontsize=14)
axes[1,0].set_ylabel('Count', fontsize=14)
axes[1,0].yaxis.tick_left()

sns.boxenplot(x = 'quality', y = 'total sulfur dioxide', data = wine, hue = 'quality',ax = axes[1,1])
axes[1,1].set_xlabel('Quality', fontsize=14)
axes[1,1].set_ylabel('Total Sulfur Dioxide', fontsize=14)
axes[1,1].yaxis.set_label_position("right")
axes[1,1].yaxis.tick_right()

plt.show();

f, axes = plt.subplots(1,2,figsize=(14,4))

sns.distplot(wine['density'], ax = axes[0])
axes[0].set_xlabel('Density', fontsize=14)
axes[0].set_ylabel('Count', fontsize=14)
axes[0].yaxis.tick_left()

sns.violinplot(x = 'quality', y = 'density', data = wine, hue = 'quality',ax = axes[1])
axes[1].set_xlabel('Quality', fontsize=14)
axes[1].set_ylabel('Density', fontsize=14)
axes[1].yaxis.set_label_position("right")
axes[1].yaxis.tick_right()

plt.show();

f, axes = plt.subplots(1,2,figsize=(14,4))

sns.distplot(wine['pH'], ax = axes[0])
axes[0].set_xlabel('pH', fontsize=14)
axes[0].set_ylabel('Count', fontsize=14)
axes[0].yaxis.tick_left()

sns.violinplot(x = 'quality', y = 'pH', data = wine, hue = 'quality',ax = axes[1])
axes[1].set_xlabel('Quality', fontsize=14)
axes[1].set_ylabel('pH', fontsize=14)
axes[1].yaxis.set_label_position("right")
axes[1].yaxis.tick_right()

plt.show();

f, axes = plt.subplots(1,2,figsize=(14,4))

sns.distplot(wine['sulphates'], ax = axes[0])
axes[0].set_xlabel('Sulphates', fontsize=14)
axes[0].set_ylabel('Count', fontsize=14)
axes[0].yaxis.tick_left()

sns.violinplot(x = 'quality', y = 'sulphates', data = wine, hue = 'quality',ax = axes[1])
axes[1].set_xlabel('Quality', fontsize=14)
axes[1].set_ylabel('Sulphates', fontsize=14)
axes[1].yaxis.set_label_position("right")
axes[1].yaxis.tick_right()

plt.show();

f, axes = plt.subplots(1,2,figsize=(14,4))

sns.distplot(wine['alcohol'], ax = axes[0])
axes[0].set_xlabel('Alcohol', fontsize=14)
axes[0].set_ylabel('Count', fontsize=14)
axes[0].yaxis.tick_left()

sns.violinplot(x = 'quality', y = 'alcohol', data = wine, hue = 'quality',ax = axes[1])
axes[1].set_xlabel('Quality', fontsize=14)
axes[1].set_ylabel('Alcohol', fontsize=14)
axes[1].yaxis.set_label_position("right")
axes[1].yaxis.tick_right()

plt.show();

X = wine.drop('quality', axis = 1).values
y = wine['quality'].values.reshape(-1,1)
# train set 과 test set 으로 분류

X_train, X_test, y_train, y_test = train_test_split(X, y, test_size = 0.25, random_state = 30)
print("Shape of X_train: ",X_train.shape)
print("Shape of X_test: ", X_test.shape)
print("Shape of y_train: ",y_train.shape)
print("Shape of y_test",y_test.shape)
Shape of X_train:  (1199, 11)
Shape of X_test:  (400, 11)
Shape of y_train:  (1199, 1)
Shape of y_test (400, 1)
- train set 과 test set 으로 잘 분류되었다.
# scaling

scale = StandardScaler()
X_train_scaled = scale.fit_transform(X_train)
X_test_scaled = scale.transform(X_test)
# ridge regression 과 linear regression 비교

ridge = Ridge()
ridge.fit(X_train, y_train)

lr = LinearRegression()
lr.fit(X_train, y_train)
LinearRegression()
print('train set ridge score :{:.3f}'.format(ridge.score(X_train, y_train)))
print('train set linear score :{:.3f}'.format(lr.score(X_train, y_train)))
print('test set ridge score :{:.3f}'.format(ridge.score(X_test, y_test)))
print('test set linear score :{:.3f}'.format(lr.score(X_test, y_test)))
train set ridge score :0.243
train set linear score :0.250
test set ridge score :0.192
test set linear score :0.199
- linear regression 과 ridge regression 의 train set 과 test set 의 차이가 나지 않기 때문에 과적합은 없는것으로 보인다.
만약 과적합 상태라면 Linear regression 의 train set 과 test set 의 차이가 크게 난다.
alpha_train_score = []
alpha_test_score = []
alpha_set = [0.1, 1 ,10]

for i in alpha_set:
    ridge = Ridge(alpha = i)
    ridge.fit(X_train, y_train)

    ridge_tr_score = round(ridge.score(X_train, y_train), 3)
    ridge_te_score = round(ridge.score(X_test, y_test), 3)

    alpha_train_score.append(ridge_tr_score)
    alpha_test_score.append(ridge_te_score)

print(alpha_set)
print(alpha_train_score)
print(alpha_test_score)
[0.1, 1, 10]
[0.244, 0.243, 0.237]
[0.192, 0.192, 0.193]
- train set 은 alpha 값이 커질수록 정확도가 떨어지는걸 알수 있는데,
alpha 값이 커진다는 것은 모델에 규제를 강화한다고 말할수 있기 때문에 그만큼 정확도가 떨어지는걸 알수있다.
하지만 위에서본바와 같이 정확도는 낮으나 그만큼 과적합도 없는 것으로 보인다.

Leave a comment