AI Bootcamp 열아홉번째
Updated:

열아홉번째 Diary
Multiple Linear Regression
# library import

import pandas as pd
import numpy as np
from collections import Counter
from sklearn.preprocessing import StandardScaler
from sklearn.decomposition import PCA
from sklearn.linear_model import LinearRegression
import statsmodels.api as sm
from sklearn.model_selection import train_test_split
from statsmodels.stats.outliers_influence import variance_inflation_factor
from sklearn.metrics import mean_squared_error
import seaborn as sns
import matplotlib.pyplot as plt

# 레티나 설정 : 글자가 흐릿하게 보이는 현상 방지
%config InlineBackend.figure_format = 'retina'

# warning 방지
import warnings
warnings.filterwarnings(action = 'ignore')
kaggle 에서 Rde Wine Quality 라는 데이터를 이용하여 몇개의 회귀분석을 해보겠다.
wine = pd.read_csv('https://raw.githubusercontent.com/Liam427/stuydy-data/main/data/winequality-red.csv')
wine.head()
| fixed acidity | volatile acidity | citric acid | residual sugar | chlorides | free sulfur dioxide | total sulfur dioxide | density | pH | sulphates | alcohol | quality | |
|---|---|---|---|---|---|---|---|---|---|---|---|---|
| 0 | 7.4 | 0.70 | 0.00 | 1.9 | 0.076 | 11.0 | 34.0 | 0.9978 | 3.51 | 0.56 | 9.4 | 5 |
| 1 | 7.8 | 0.88 | 0.00 | 2.6 | 0.098 | 25.0 | 67.0 | 0.9968 | 3.20 | 0.68 | 9.8 | 5 |
| 2 | 7.8 | 0.76 | 0.04 | 2.3 | 0.092 | 15.0 | 54.0 | 0.9970 | 3.26 | 0.65 | 9.8 | 5 |
| 3 | 11.2 | 0.28 | 0.56 | 1.9 | 0.075 | 17.0 | 60.0 | 0.9980 | 3.16 | 0.58 | 9.8 | 6 |
| 4 | 7.4 | 0.70 | 0.00 | 1.9 | 0.076 | 11.0 | 34.0 | 0.9978 | 3.51 | 0.56 | 9.4 | 5 |
- fixed acidity : 고정 산도
- volatile acidity : 휘발성 산도
- citric acid : 구연산
- residual sugar : 잔류 설탕
- chlorides : 염화물
- free sulfur dioxide : 유리 이산화황
- total sulfur dioxide : 총 이산화황
- density : 밀도
- pH :산도
- sulphates : 황산염
- alcohol : 알콜 도수
12 Output variable (based on sensory data):
- quality (score between 0 and 10) : target feature
#데이터 수와 변수의 수 확인하기
nCar = wine.shape[0]
nVar = wine.shape[1]

print(nCar, nVar)
1599 12
# 데이터의 info 확인하기

wine.info()
<class 'pandas.core.frame.DataFrame'>
RangeIndex: 1599 entries, 0 to 1598
Data columns (total 12 columns):
 #   Column                Non-Null Count  Dtype
---  ------                --------------  -----
 0   fixed acidity         1599 non-null   float64
 1   volatile acidity      1599 non-null   float64
 2   citric acid           1599 non-null   float64
 3   residual sugar        1599 non-null   float64
 4   chlorides             1599 non-null   float64
 5   free sulfur dioxide   1599 non-null   float64
 6   total sulfur dioxide  1599 non-null   float64
 7   density               1599 non-null   float64
 8   pH                    1599 non-null   float64
 9   sulphates             1599 non-null   float64
 10  alcohol               1599 non-null   float64
 11  quality               1599 non-null   int64
dtypes: float64(11), int64(1)
memory usage: 150.0 KB
- 확실히 캐글에서 가져온 데이터라 그런지 결측치도 없고, object 로 된 값들도 없다.
# 데이터의 컬럼명 확인

wine.columns
Index(['fixed acidity', 'volatile acidity', 'citric acid', 'residual sugar',
       'chlorides', 'free sulfur dioxide', 'total sulfur dioxide', 'density',
       'pH', 'sulphates', 'alcohol', 'quality'],
      dtype='object')
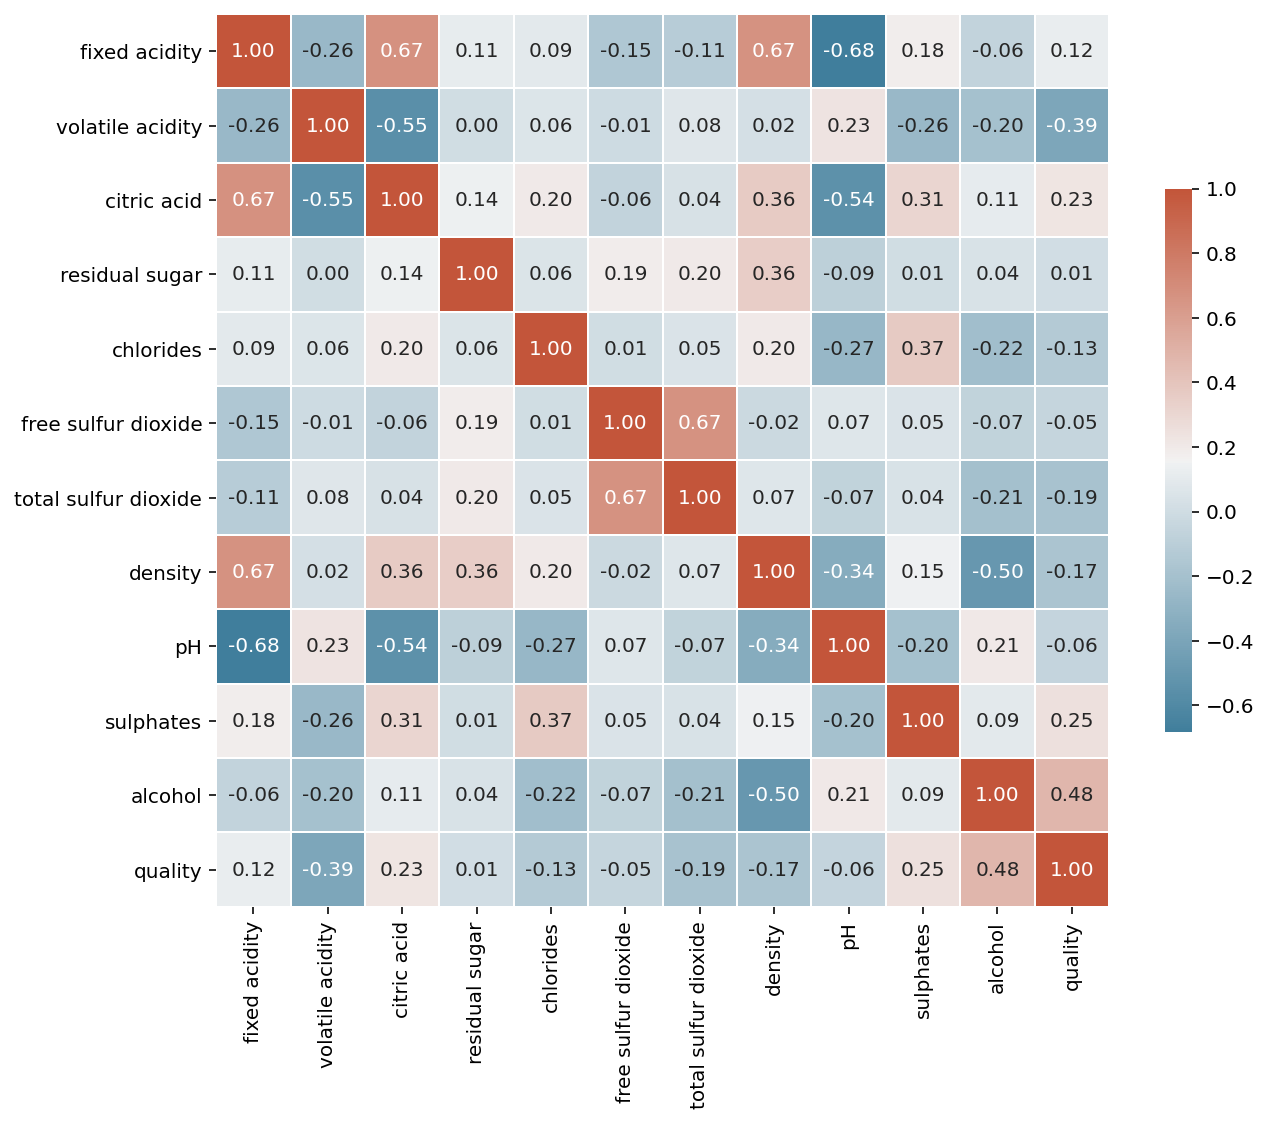
# 상관관계를 구하여 heatmap 으로 표현

wine_corr = wine.corr()

plt.figure(figsize = (10, 10))
cmap = sns.diverging_palette(230, 20, as_cmap=True)
sns.heatmap(wine_corr, annot=True, fmt=".2f", cmap = cmap,
            square = True, linewidths = .5, cbar_kws={"shrink": .5})
plt.show();

- target 변수인 quality 와 상관관계가 높은 변수는 없다.
# Counter 함수로 각 key 당 몇번의 value 를 가지는지 확인 할수 있다.

Counter(wine['quality'])
Counter({5: 681, 6: 638, 7: 199, 4: 53, 8: 18, 3: 10})
- 3점 = 10개, 4점 = 53개,5점 = 681개, 6점 = 638개, 7점 = 199개, 8점 = 18개
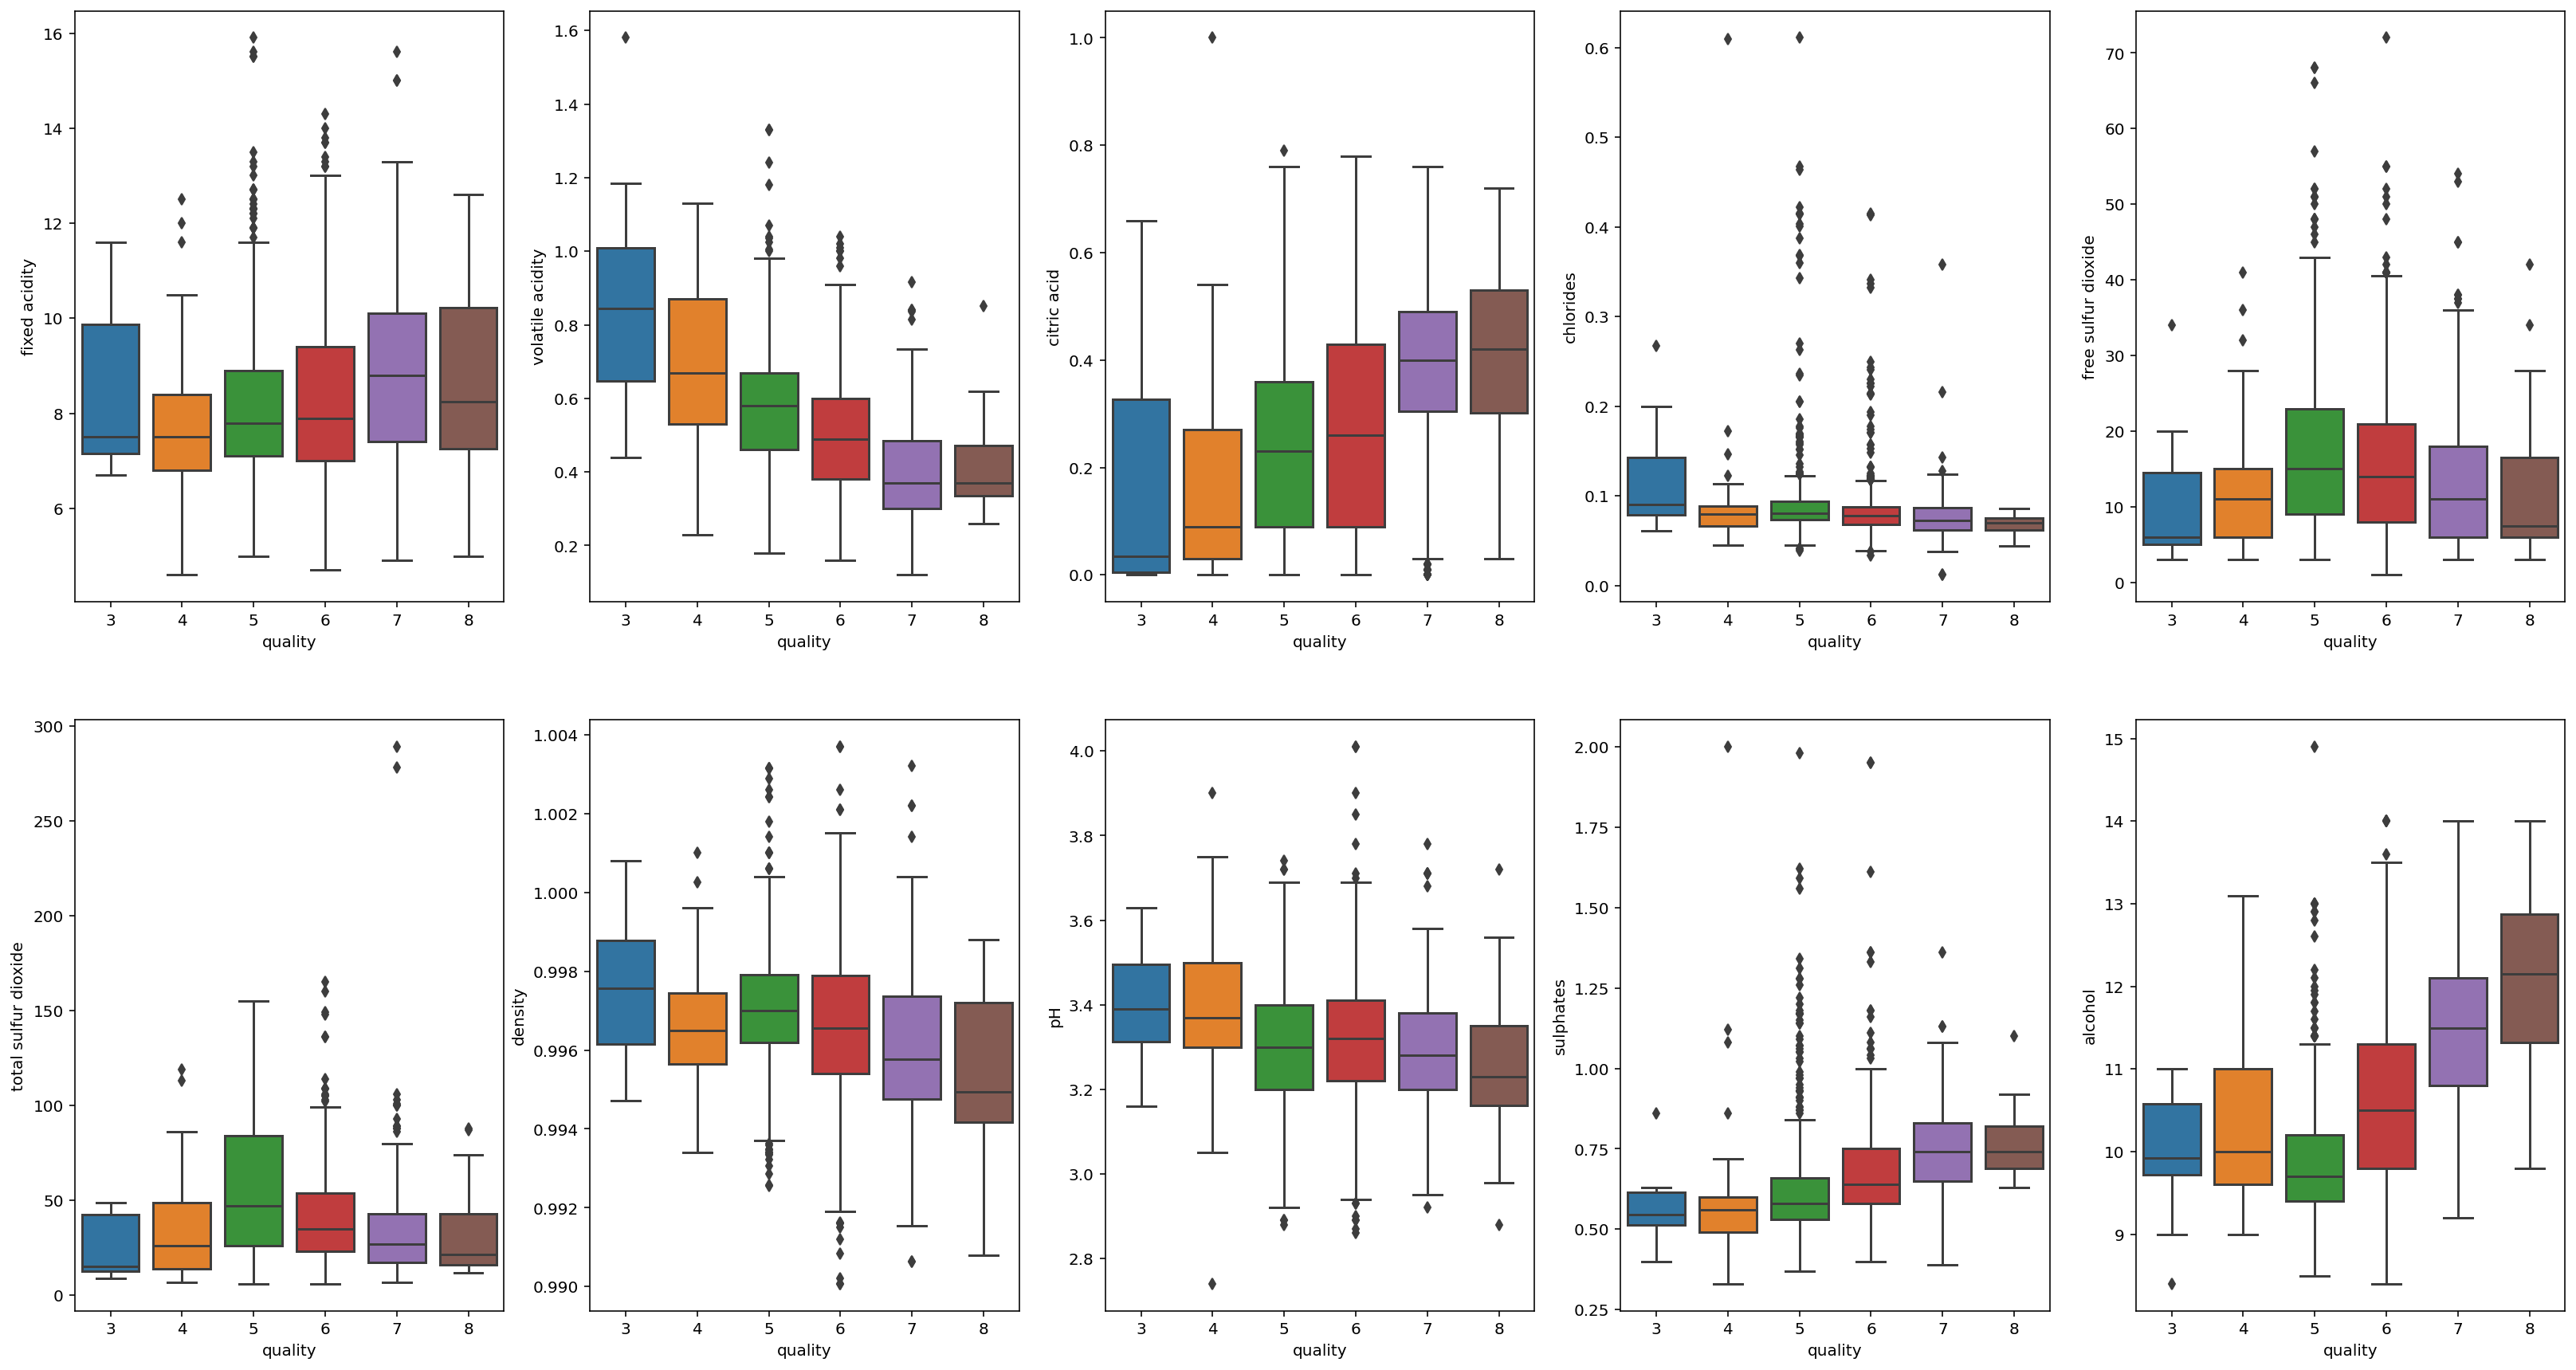
# outlier 를 확인 해 볼것인데, boxplot 을 이용하여 알아 보겠다.

plt.figure(figsize=(28,15))

plt.subplot(2,5,1)
sns.boxplot('quality', 'fixed acidity', data = wine)

plt.subplot(2,5,2)
sns.boxplot('quality', 'volatile acidity', data = wine)

plt.subplot(2,5,3)
sns.boxplot('quality', 'citric acid', data = wine)

plt.subplot(2,5,4)
sns.boxplot('quality', 'chlorides', data = wine)

plt.subplot(2,5,5)
sns.boxplot('quality', 'free sulfur dioxide', data = wine)

plt.subplot(2,5,6)
sns.boxplot('quality', 'total sulfur dioxide', data = wine)

plt.subplot(2,5,7)
sns.boxplot('quality', 'density', data = wine)

plt.subplot(2,5,8)
sns.boxplot('quality', 'pH', data = wine)

plt.subplot(2,5,9)
sns.boxplot('quality', 'sulphates', data = wine)

plt.subplot(2,5,10)
sns.boxplot('quality', 'alcohol', data = wine)

plt.show();

- outlier 가 상당히 많은 걸로 보이므로 다시한번 describe 함수로 살펴봐야겠다.
wine.describe()
| fixed acidity | volatile acidity | citric acid | residual sugar | chlorides | free sulfur dioxide | total sulfur dioxide | density | pH | sulphates | alcohol | quality | |
|---|---|---|---|---|---|---|---|---|---|---|---|---|
| count | 1599.000000 | 1599.000000 | 1599.000000 | 1599.000000 | 1599.000000 | 1599.000000 | 1599.000000 | 1599.000000 | 1599.000000 | 1599.000000 | 1599.000000 | 1599.000000 |
| mean | 8.319637 | 0.527821 | 0.270976 | 2.538806 | 0.087467 | 15.874922 | 46.467792 | 0.996747 | 3.311113 | 0.658149 | 10.422983 | 5.636023 |
| std | 1.741096 | 0.179060 | 0.194801 | 1.409928 | 0.047065 | 10.460157 | 32.895324 | 0.001887 | 0.154386 | 0.169507 | 1.065668 | 0.807569 |
| min | 4.600000 | 0.120000 | 0.000000 | 0.900000 | 0.012000 | 1.000000 | 6.000000 | 0.990070 | 2.740000 | 0.330000 | 8.400000 | 3.000000 |
| 25% | 7.100000 | 0.390000 | 0.090000 | 1.900000 | 0.070000 | 7.000000 | 22.000000 | 0.995600 | 3.210000 | 0.550000 | 9.500000 | 5.000000 |
| 50% | 7.900000 | 0.520000 | 0.260000 | 2.200000 | 0.079000 | 14.000000 | 38.000000 | 0.996750 | 3.310000 | 0.620000 | 10.200000 | 6.000000 |
| 75% | 9.200000 | 0.640000 | 0.420000 | 2.600000 | 0.090000 | 21.000000 | 62.000000 | 0.997835 | 3.400000 | 0.730000 | 11.100000 | 6.000000 |
| max | 15.900000 | 1.580000 | 1.000000 | 15.500000 | 0.611000 | 72.000000 | 289.000000 | 1.003690 | 4.010000 | 2.000000 | 14.900000 | 8.000000 |
- 이렇게 보니 몇몇 column 들의 값들의 max 값이 평균값들 보다 굉장히 차이가 많이 나는걸 알수 있다.
# review 라는 새로운 column 을 만들어서 quality 점수별로 3등분으로 나눠주는게 알맞을 것 같다.
# 1, 2, 3 --> Bad = 1
# 4, 5, 6, 7 --> Average = 2
# 8, 9, 10 --> Excellent = 3
# 으로 각 점수의 영역을 정해 나눠 주도록 하겠다.

reviews = []
for i in wine['quality']:
    if i >= 1 and i <= 3:
        reviews.append('1')
    elif i >=4 and i <= 7:
        reviews.append('2')
    else:
        reviews.append('3')

wine['reviews'] = reviews
wine.head()
| fixed acidity | volatile acidity | citric acid | residual sugar | chlorides | free sulfur dioxide | total sulfur dioxide | density | pH | sulphates | alcohol | quality | reviews | |
|---|---|---|---|---|---|---|---|---|---|---|---|---|---|
| 0 | 7.4 | 0.70 | 0.00 | 1.9 | 0.076 | 11.0 | 34.0 | 0.9978 | 3.51 | 0.56 | 9.4 | 5 | 2 |
| 1 | 7.8 | 0.88 | 0.00 | 2.6 | 0.098 | 25.0 | 67.0 | 0.9968 | 3.20 | 0.68 | 9.8 | 5 | 2 |
| 2 | 7.8 | 0.76 | 0.04 | 2.3 | 0.092 | 15.0 | 54.0 | 0.9970 | 3.26 | 0.65 | 9.8 | 5 | 2 |
| 3 | 11.2 | 0.28 | 0.56 | 1.9 | 0.075 | 17.0 | 60.0 | 0.9980 | 3.16 | 0.58 | 9.8 | 6 | 2 |
| 4 | 7.4 | 0.70 | 0.00 | 1.9 | 0.076 | 11.0 | 34.0 | 0.9978 | 3.51 | 0.56 | 9.4 | 5 | 2 |
Counter(wine['reviews'])
Counter({'2': 1571, '3': 18, '1': 10})
- 1점 = 10개, 2점 = 1571개, 3점 = 18개
잘 나눠져 있는것으로 보인다.
# target 변수와 그렇지 않은 변수들을 나누기

X = wine.iloc[:,:11]
y = wine['reviews']
X.head()
| fixed acidity | volatile acidity | citric acid | residual sugar | chlorides | free sulfur dioxide | total sulfur dioxide | density | pH | sulphates | alcohol | |
|---|---|---|---|---|---|---|---|---|---|---|---|
| 0 | 7.4 | 0.70 | 0.00 | 1.9 | 0.076 | 11.0 | 34.0 | 0.9978 | 3.51 | 0.56 | 9.4 |
| 1 | 7.8 | 0.88 | 0.00 | 2.6 | 0.098 | 25.0 | 67.0 | 0.9968 | 3.20 | 0.68 | 9.8 |
| 2 | 7.8 | 0.76 | 0.04 | 2.3 | 0.092 | 15.0 | 54.0 | 0.9970 | 3.26 | 0.65 | 9.8 |
| 3 | 11.2 | 0.28 | 0.56 | 1.9 | 0.075 | 17.0 | 60.0 | 0.9980 | 3.16 | 0.58 | 9.8 |
| 4 | 7.4 | 0.70 | 0.00 | 1.9 | 0.076 | 11.0 | 34.0 | 0.9978 | 3.51 | 0.56 | 9.4 |
y.head()
0    2
1    2
2    2
3    2
4    2
Name: reviews, dtype: object
# standardscaler 를 이용해 scaling 하기

scale = StandardScaler()
X = scale.fit_transform(X)
print(X)
[[-0.52835961  0.96187667 -1.39147228 ...  1.28864292 -0.57920652
  -0.96024611]
 [-0.29854743  1.96744245 -1.39147228 ... -0.7199333   0.1289504
  -0.58477711]
 [-0.29854743  1.29706527 -1.18607043 ... -0.33117661 -0.04808883
  -0.58477711]
 ...
 [-1.1603431  -0.09955388 -0.72391627 ...  0.70550789  0.54204194
   0.54162988]
 [-1.39015528  0.65462046 -0.77526673 ...  1.6773996   0.30598963
  -0.20930812]
 [-1.33270223 -1.21684919  1.02199944 ...  0.51112954  0.01092425
   0.54162988]]
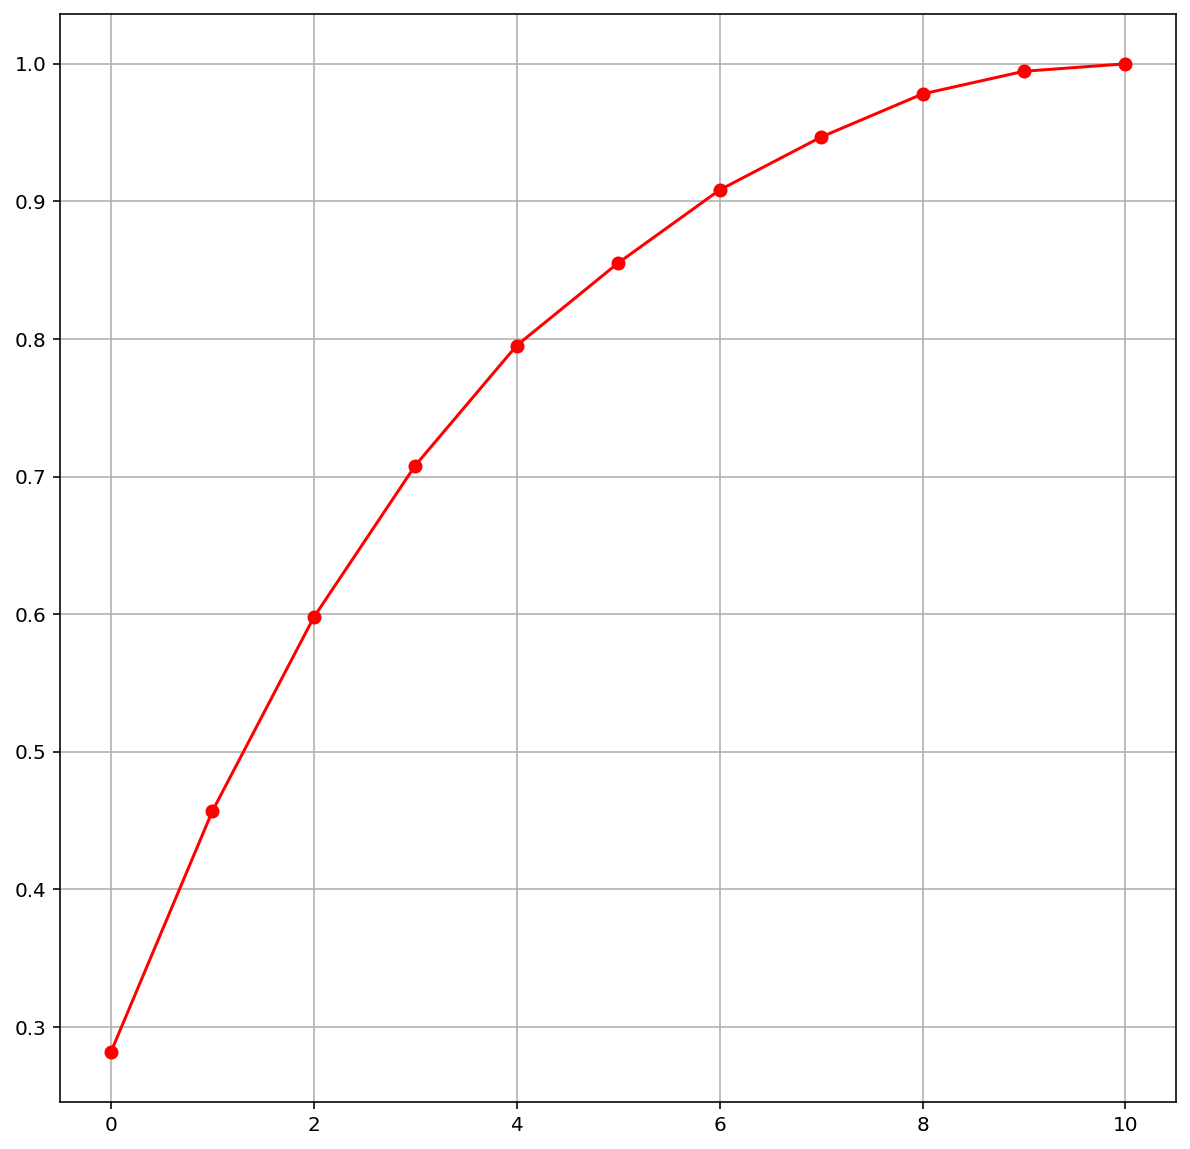
# pca 를 통해 차원 축소

pca = PCA()
X_pca = pca.fit_transform(X)
plt.figure(figsize=(10,10))
plt.plot(np.cumsum(pca.explained_variance_ratio_), 'ro-')
plt.grid()
plt.show();

- 그래프를 보시면 8차원 정도로 줄였을때 와 전체의 feature 를 다했을 때와 크게 달라진 점을 볼수 없으므로,
8차원이 가장 이상적인 차원축소라고 생각을 하고 진행을 하겠다.
# pca 를 이용해 8차원으로 줄여 진행

pca_e = PCA(n_components = 8)
X_e = pca_e.fit_transform(X)
print(X_e)
[[-1.61952988  0.45095009 -1.77445415 ... -0.91392069 -0.16104319
  -0.28225828]
 [-0.79916993  1.85655306 -0.91169017 ...  0.92971392 -1.00982858
   0.76258697]
 [-0.74847909  0.88203886 -1.17139423 ...  0.40147313 -0.53955348
   0.59794606]
 ...
 [-1.45612897  0.31174559  1.12423941 ... -0.50640956 -0.23108221
   0.07938219]
 [-2.27051793  0.97979111  0.62796456 ... -0.86040762 -0.32148695
  -0.46887589]
 [-0.42697475 -0.53669021  1.6289552  ... -0.49615364  1.18913227
   0.04217568]]
# 데이터를 split 하기전에 상수항 추가하기

wine = sm.add_constant(wine, has_constant="add")
X_train, X_test, y_train, y_test = train_test_split(X_e, y, test_size = 0.25, random_state = 30)
X_train, X_val, y_train, y_val = train_test_split(X_train, y_train, test_size = 0.25, random_state = 30)
print(X_train.shape)
print(y_train.shape)
print(X_val.shape)
print(y_val.shape)
print(X_test.shape)
print(y_test.shape)
(899, 8)
(899,)
(300, 8)
(300,)
(400, 8)
(400,)
# multi regression model fitting

model = LinearRegression()

model.fit(X_train, y_train)
y_pred1 = model.predict(X_train)
mse1 = mean_squared_error(y_train, y_pred1)
print('훈련 에러:', mse1)
훈련 에러: 0.02103518573963981
# 테스트 데이터에 적용

y_pred2 = model.predict(X_test)
mse2 = mean_squared_error(y_test, y_pred2)
print('테스트 에러:', mse2)
테스트 에러: 0.014611964581066133
#다중 회귀 분석 모델 생성
X = wine[['fixed acidity', 'volatile acidity', 'citric acid', 'residual sugar',
          'chlorides', 'free sulfur dioxide', 'total sulfur dioxide', 'density',
          'pH', 'sulphates', 'alcohol']]
Y = wine[['quality']]

#회귀모델에 constant 추가
X_const = sm.add_constant(X)

#회귀분석
model = sm.OLS(Y, X_const)
result = model.fit()
result.summary()
| Dep. Variable: | quality | R-squared: | 0.361 |
|---|---|---|---|
| Model: | OLS | Adj. R-squared: | 0.356 |
| Method: | Least Squares | F-statistic: | 81.35 |
| Date: | Sun, 07 Feb 2021 | Prob (F-statistic): | 1.79e-145 |
| Time: | 20:36:14 | Log-Likelihood: | -1569.1 |
| No. Observations: | 1599 | AIC: | 3162. |
| Df Residuals: | 1587 | BIC: | 3227. |
| Df Model: | 11 | ||
| Covariance Type: | nonrobust |
| coef | std err | t | P>|t| | [0.025 | 0.975] | |
|---|---|---|---|---|---|---|
| const | 21.9652 | 21.195 | 1.036 | 0.300 | -19.607 | 63.538 |
| fixed acidity | 0.0250 | 0.026 | 0.963 | 0.336 | -0.026 | 0.076 |
| volatile acidity | -1.0836 | 0.121 | -8.948 | 0.000 | -1.321 | -0.846 |
| citric acid | -0.1826 | 0.147 | -1.240 | 0.215 | -0.471 | 0.106 |
| residual sugar | 0.0163 | 0.015 | 1.089 | 0.276 | -0.013 | 0.046 |
| chlorides | -1.8742 | 0.419 | -4.470 | 0.000 | -2.697 | -1.052 |
| free sulfur dioxide | 0.0044 | 0.002 | 2.009 | 0.045 | 0.000 | 0.009 |
| total sulfur dioxide | -0.0033 | 0.001 | -4.480 | 0.000 | -0.005 | -0.002 |
| density | -17.8812 | 21.633 | -0.827 | 0.409 | -60.314 | 24.551 |
| pH | -0.4137 | 0.192 | -2.159 | 0.031 | -0.789 | -0.038 |
| sulphates | 0.9163 | 0.114 | 8.014 | 0.000 | 0.692 | 1.141 |
| alcohol | 0.2762 | 0.026 | 10.429 | 0.000 | 0.224 | 0.328 |
| Omnibus: | 27.376 | Durbin-Watson: | 1.757 |
|---|---|---|---|
| Prob(Omnibus): | 0.000 | Jarque-Bera (JB): | 40.965 |
| Skew: | -0.168 | Prob(JB): | 1.27e-09 |
| Kurtosis: | 3.708 | Cond. No. | 1.13e+05 |
Notes:
[1] Standard Errors assume that the covariance matrix of the errors is correctly specified.
[2] The condition number is large, 1.13e+05. This might indicate that there are
strong multicollinearity or other numerical problems.


Leave a comment